
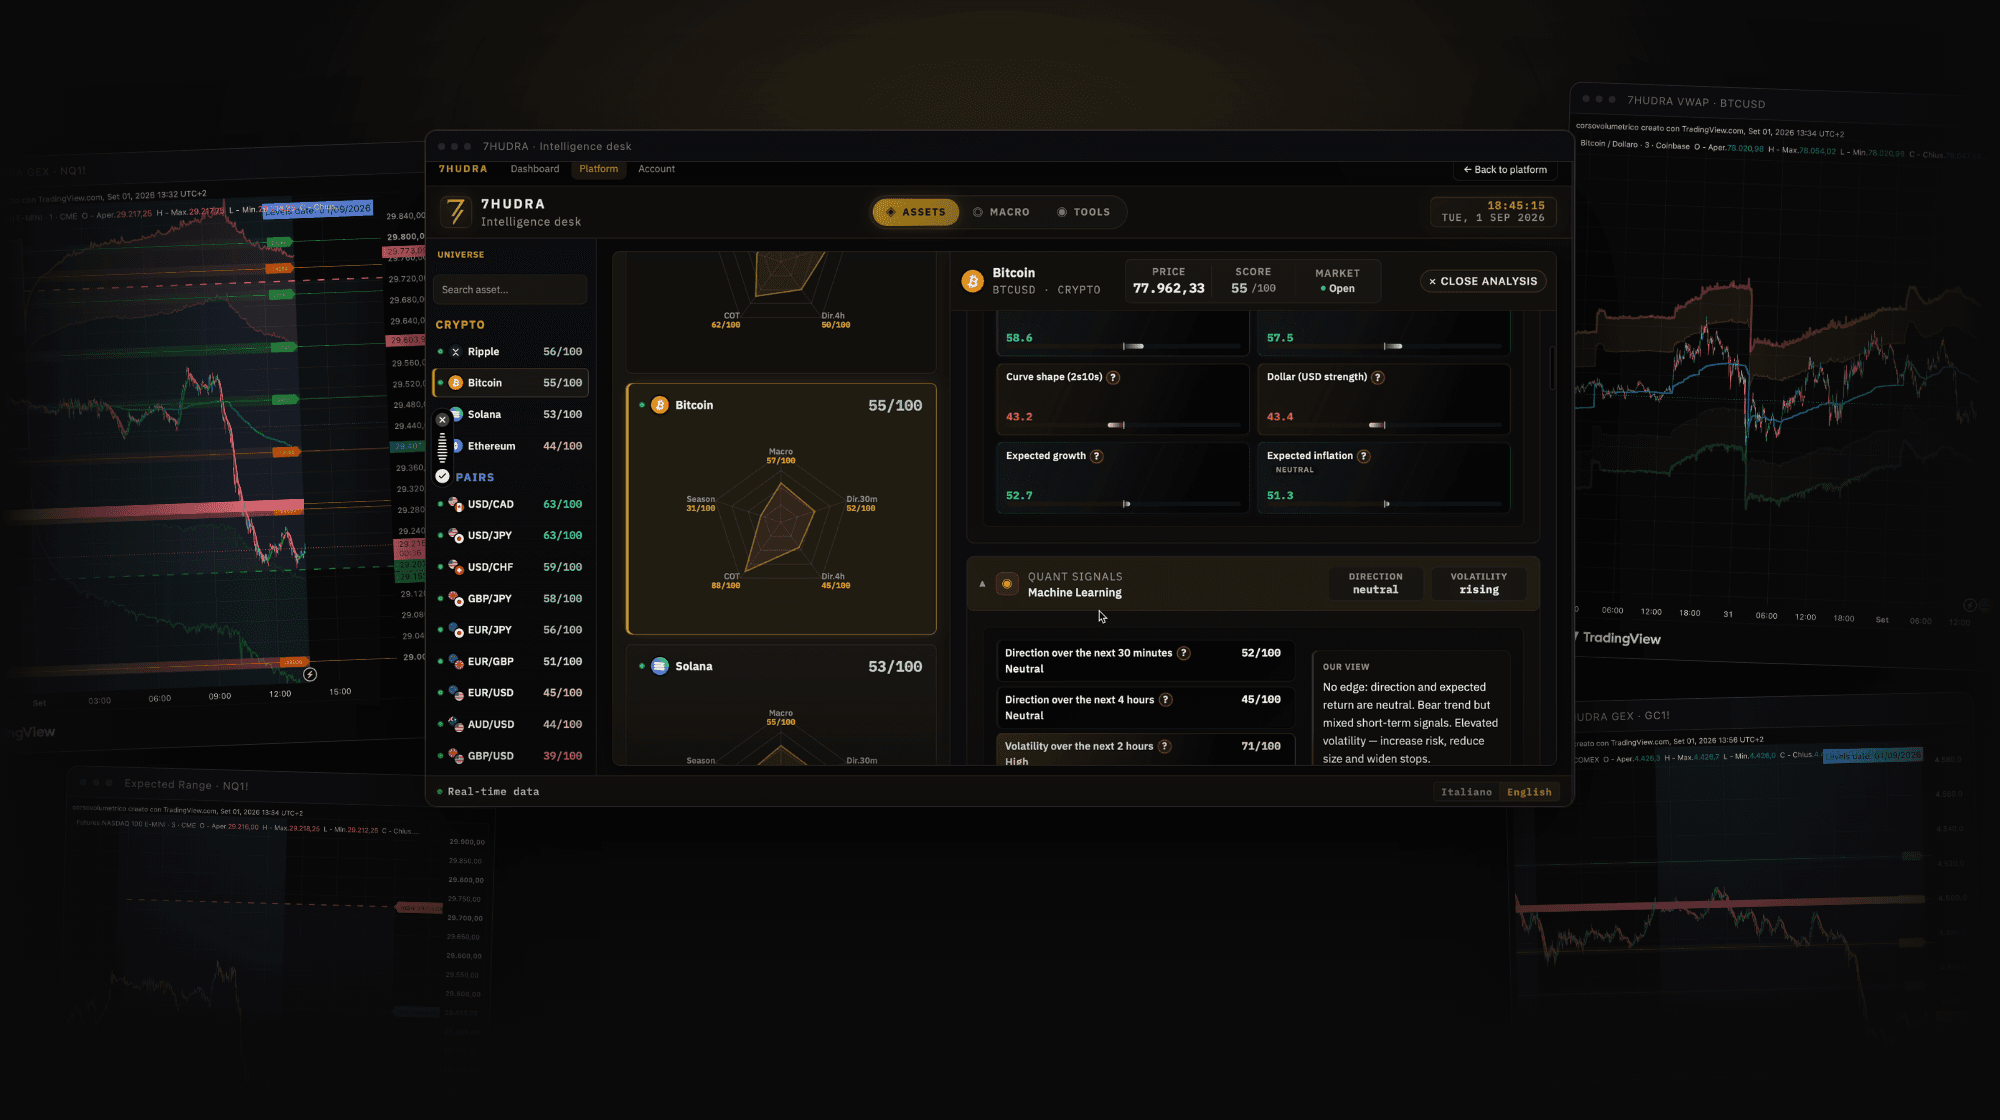
Levels that don’t
come from price. They come from obligations.
Market makers who sold those options have to hedge at certain prices. Not because they want to — because the contract says so. We pull those prices from the options chains and rebuild them every night.
Let’s be honest. Every indicator you’ve ever loaded computes something on price that already happened. Moving averages, RSI, support drawn by hand. Twenty ways of looking at the same candle, and then you wonder why the chart is crowded and the account isn’t moving.
Gamma data has been around for years. It’s either locked inside terminals that cost thousands a year, or scattered across three sites that don’t talk to each other. Levels here. Volatility there. Chart on TradingView. Alt-tabbing mid-trade like it’s 2010.
Name one tool that put those levels on your chart, refreshed every night, for under a hundred bucks a month. Exactly.
So I built it, and then I built the room where people actually learn to read it.
Two indicators. One says where. The other says whether it’s worth it.
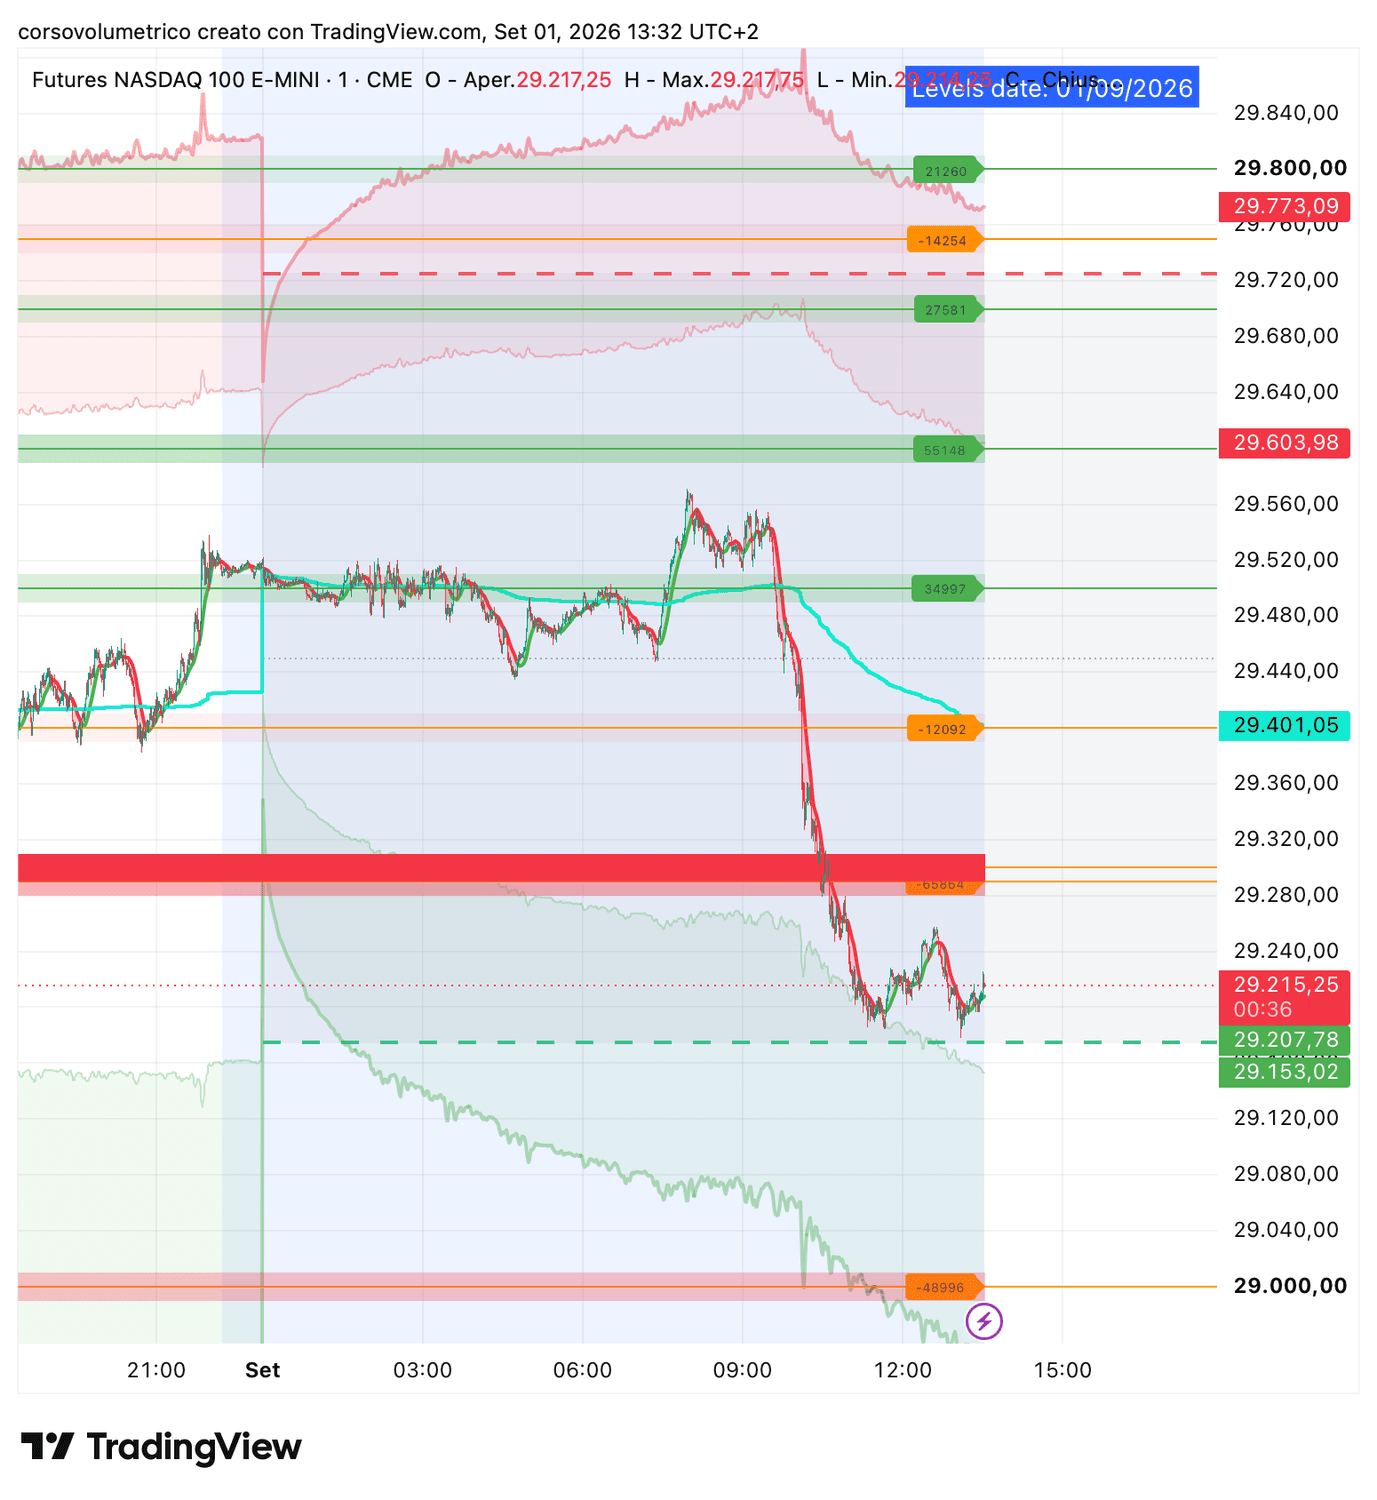
Where the hedging piles up
Gamma exposure levels computed on the options chains and rebuilt every evening after the close. Green zones are where hedging absorbs the move and price tends to stall. Red zones are where hedging follows the move — that’s where the vertical candles come from.
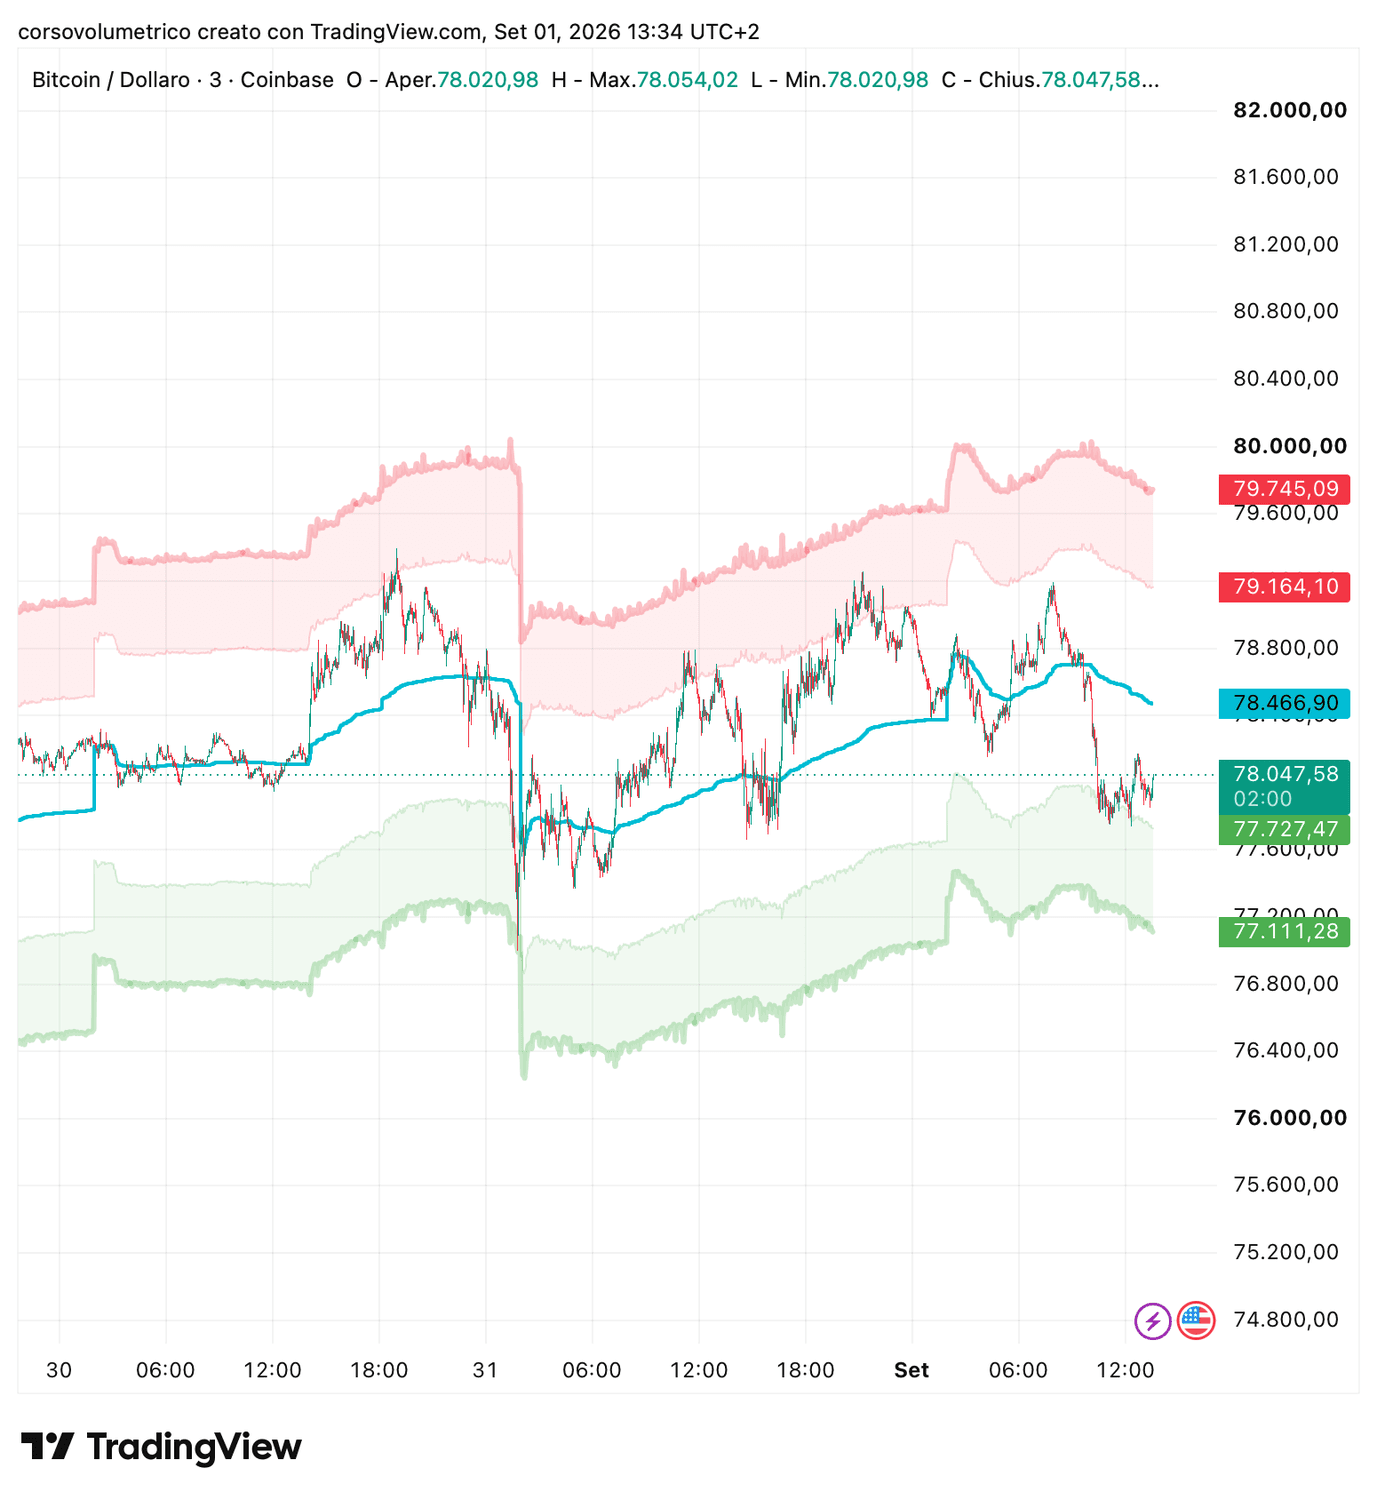
When price is stretched too far
The free VWAP won’t do this. Our bands run on the session’s expected volatility instead of a fixed standard deviation — they open up on hot days and tighten on flat ones, so a touch means the same thing in both.
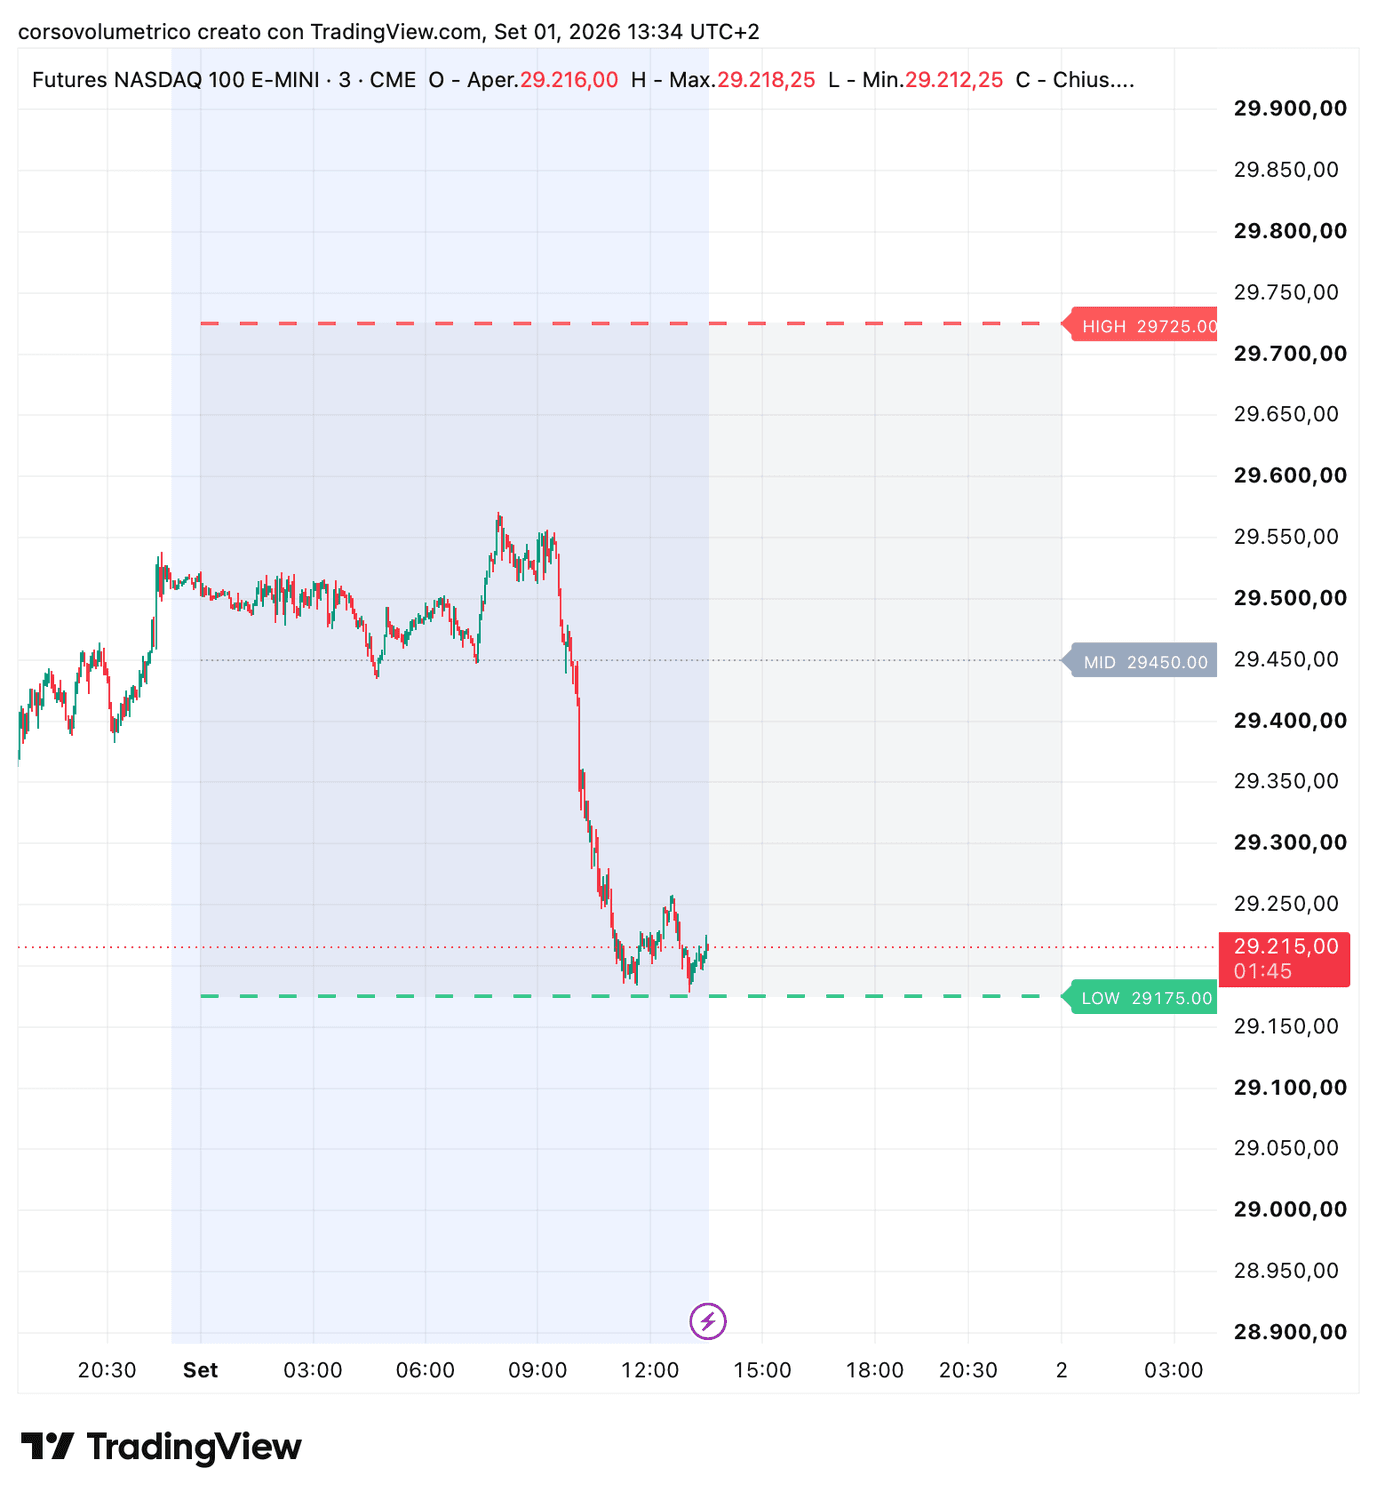
The box the session is likely to trade in
Expected Range draws the high, mid and low the session is statistically likely to hold, so you know before the open whether price is inside its box or already outside it. TWAP tracks the time-weighted average across four horizons at once — when they stack in one direction, that’s a trend with participation behind it.
The levels are the easy part. Reading them is the work.
Anyone can put lines on a chart. The Discord is where you find out which of those lines mattered today, and why the one you were watching didn’t.
Gold sits right under a heavy green zone this morning. Positive gamma up there, so hedging absorbs — I’d expect it to slow down rather than run through.
GC1! · 4,612 — 4,628Nasdaq is a different story. Zones are far apart with nothing in between — one of those days where there’s nothing to take. Swing VWAP today, CPI at 14:30.
so if it comes into the green zone from below, that’s the one to watch for exhaustion rather than a break?
And the homework, already done. Before you open the chart.
Compass scores around 27 markets every morning across five axes, so you start the day from what’s actually moving instead of a watchlist you built a year ago.
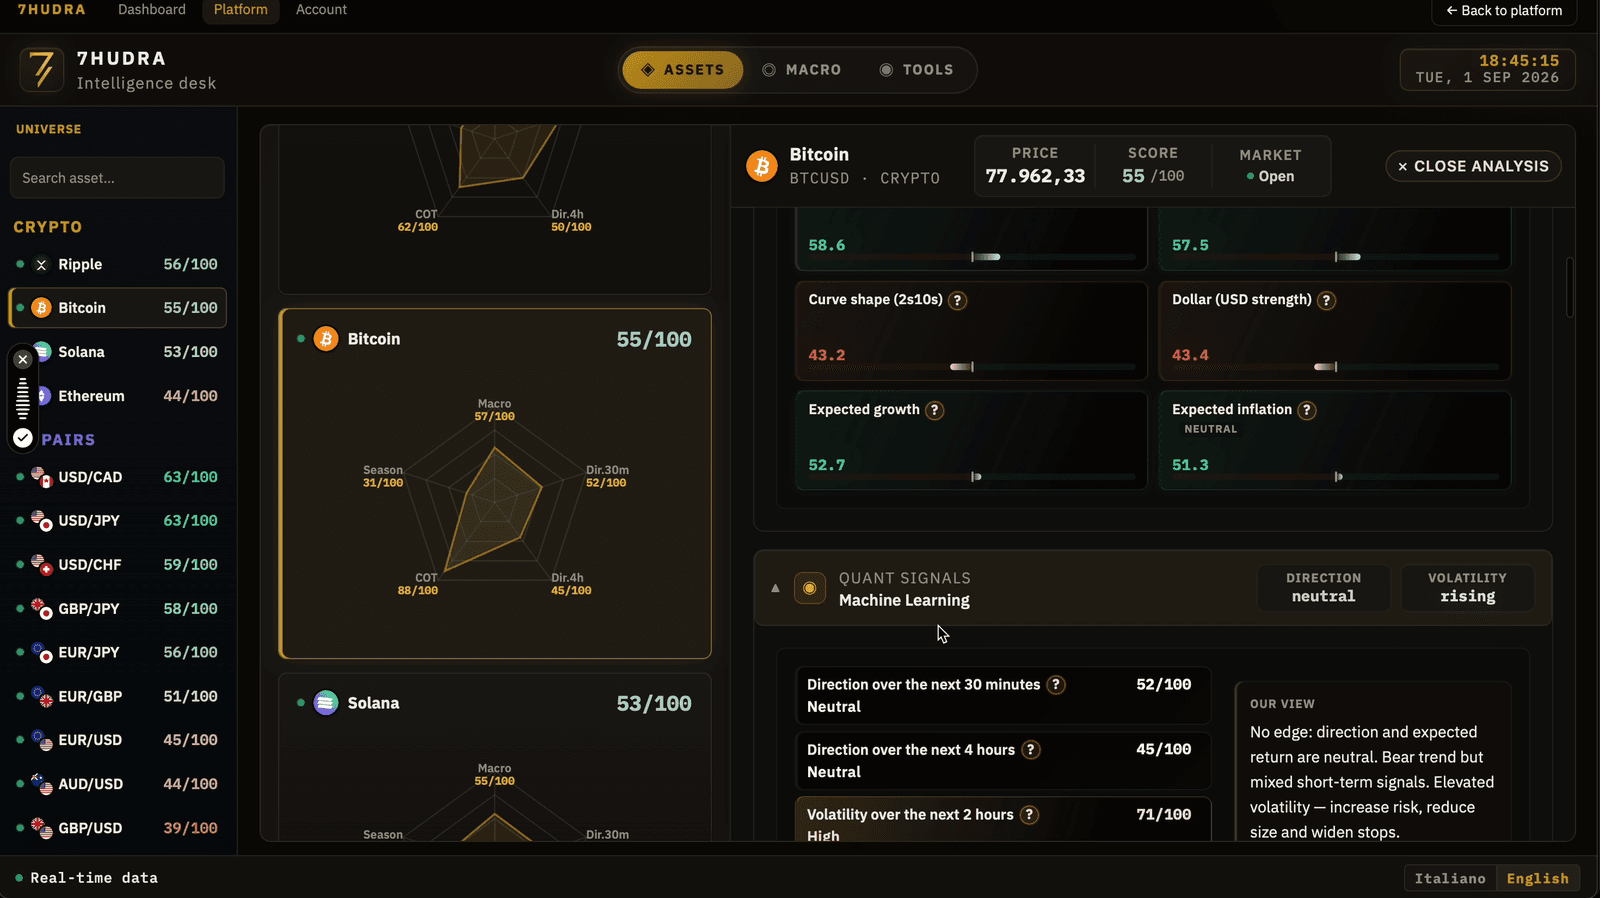
Models trained on our own data
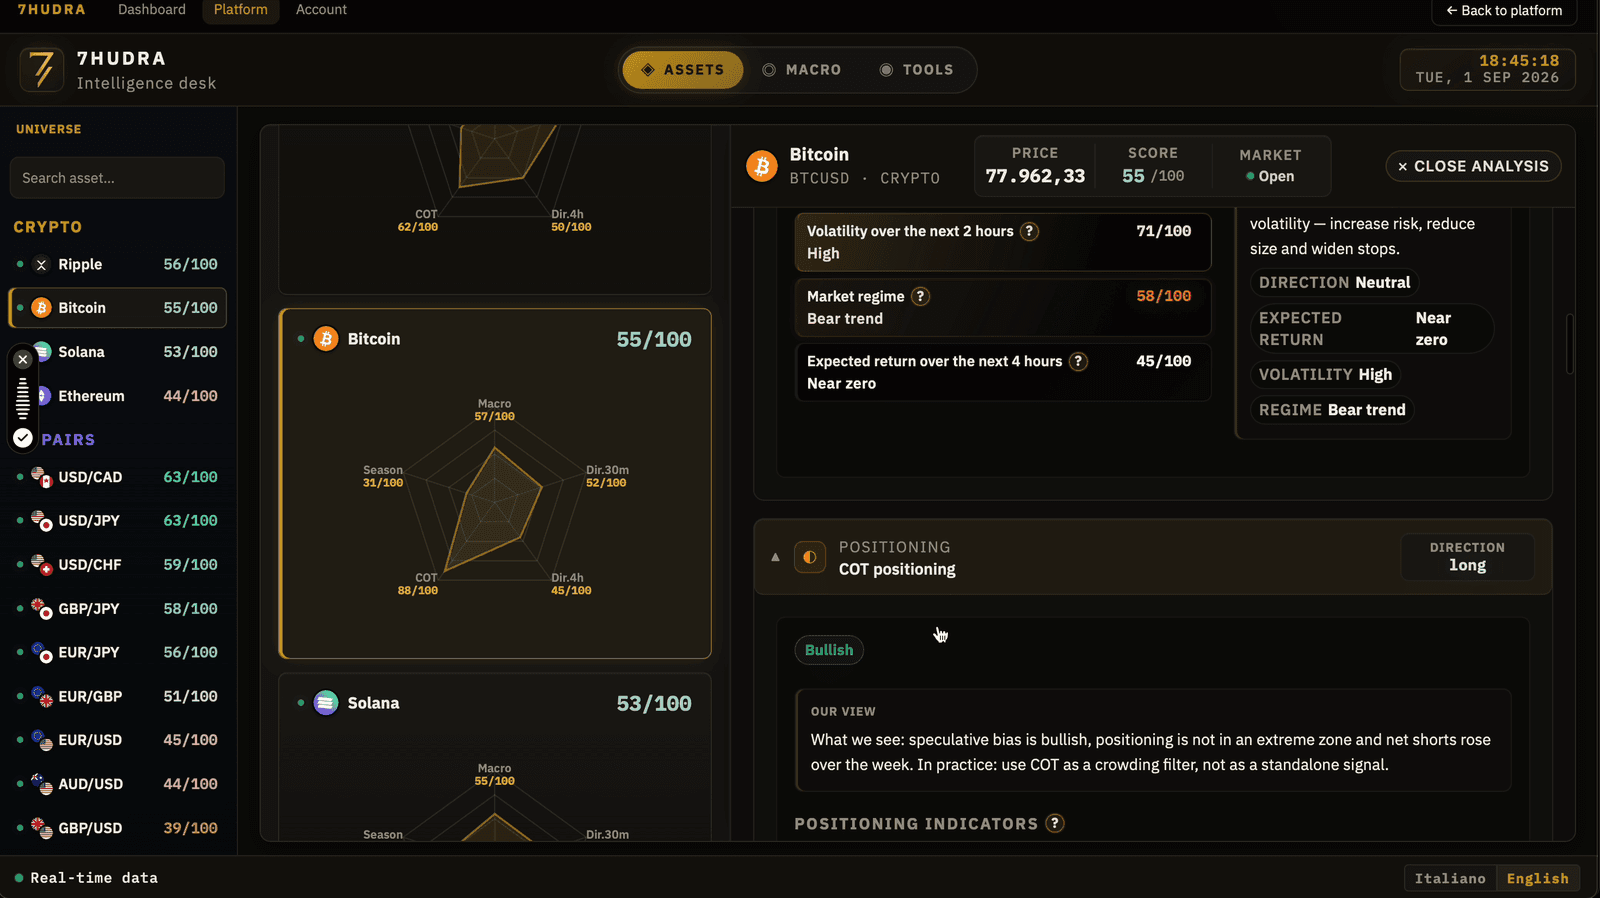
Direction over the next 30 minutes and 4 hours, expected volatility, market regime — scored 0 to 100 by models we train on our own proprietary formula, not a public library. Every output comes with a written read, so you know what the number means instead of guessing.
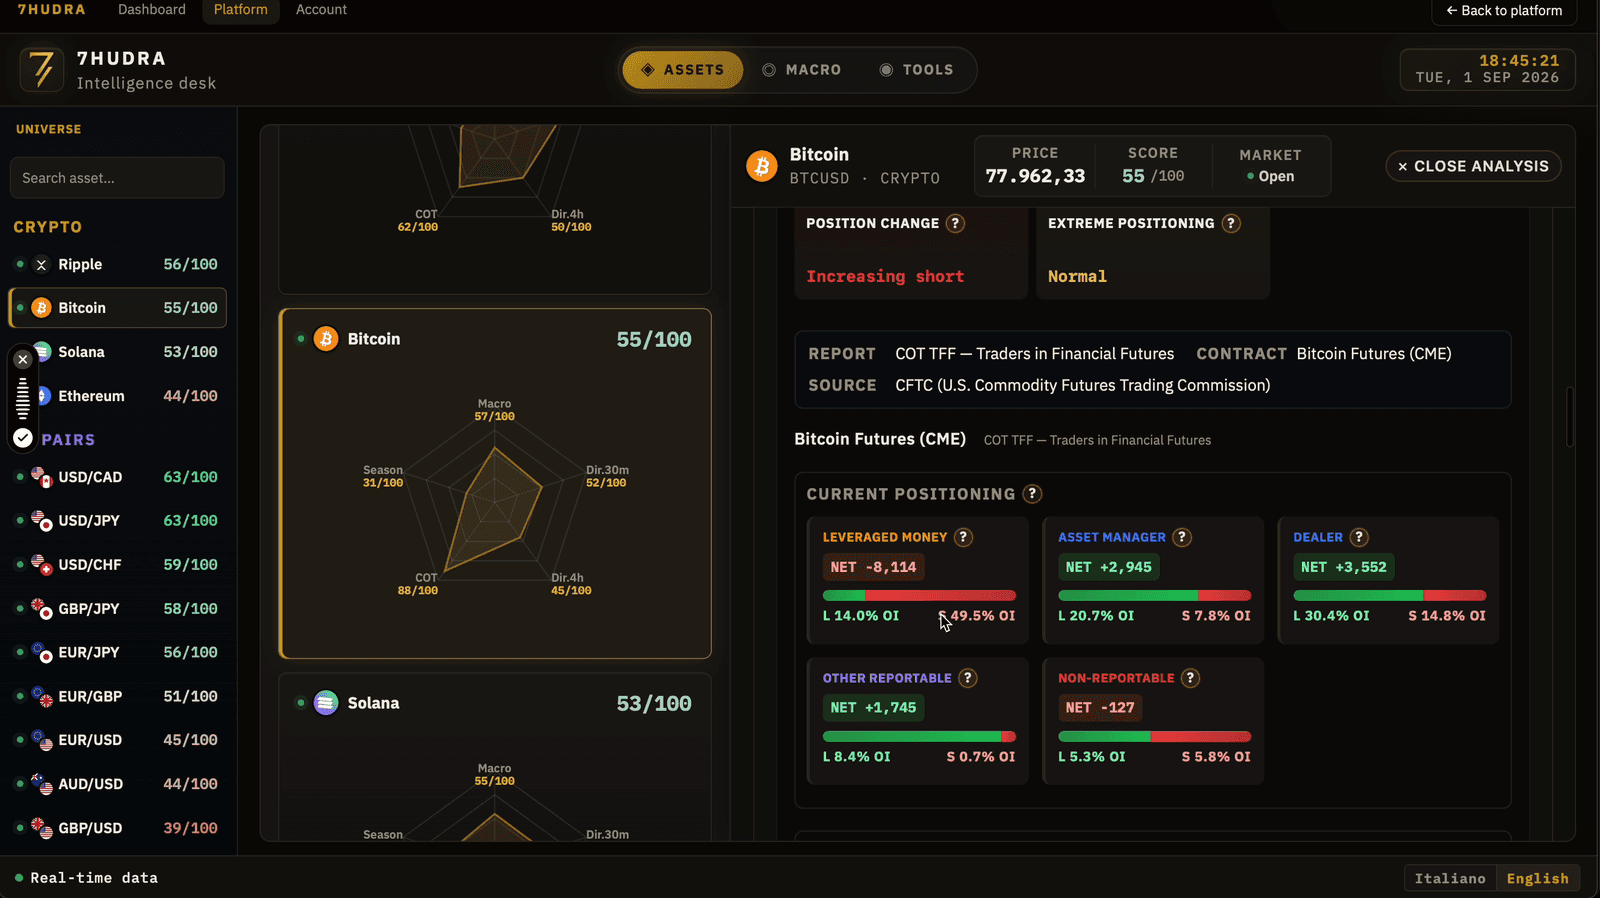
Who’s positioned, and how crowded
CFTC futures positioning broken down by participant — leveraged money, asset managers, dealers — with net exposure and open interest. Plus how that market has actually behaved in this month over the last ten years, week by week.
Context before the candle
Monetary policy, liquidity, inflation, bonds, debt and market regime. Plus an economic calendar you can filter by impact and a world risk map tied to the news.
Don’t buy the same risk twice
Before holding Nasdaq and Bitcoin together, check whether this month they’re one single risk-on bet. Usually they are, and you find out the hard way.
Pick your risk before you pay
Thousands of simulated paths on your capital, risk per trade, R:R and win rate. See how often you’d pass and how often you’d breach — before the €540, not after.
Education as it should be. Not gatekept by so-called gurus.
16 markets. One method.
Simple pricing, finally. One price. Everything in. No gotchas.
Cancel in two clicks from your account. No emails, no phone calls, nobody trying to talk you out of it.
Prices exclude VAT where applicable. Launch pricing — it goes up after this phase.
7HUDRA isn’t for everyone.
But if you want to see the market the way the people forced to move it see it — that’s what this is.
Questions? Answers.
Do I need a card to start the trial?+−
For the 7-day Full Access trial, yes — the card is registered but nothing is charged until day eight. Cancel before then and you are not billed, and cancelling takes two clicks from your account. The free Expected Range plan needs no card at all.
What exactly is free?+−
Expected Range on TradingView, on your own charts, for as long as you want it. You create an account and connect Discord so we can grant the script — that is the whole cost.
Are these signals?+−
No, and they never will be. The indicators show zones and context. Nobody tells you where to enter or exit — what you do with the map stays your call.
Why a subscription instead of a one-time purchase?+−
Because what you’re paying for isn’t the code, it’s the recalculation. Options flows change daily, so the levels get rebuilt every night. A file you downloaded once would be stale by tomorrow.
Is the course included?+−
Yes, always. No extra tier, no upsell to unlock the real content. What exists is there for every subscriber.
Do I need a paid TradingView plan?+−
A free account is enough. For real-time futures you’ll want TradingView’s exchange data subscription, around €10 a month paid to them — without it futures run on a ~10 minute delay and the levels are identical either way.
How long does activation take?+−
At checkout we ask for your TradingView username. We grant invite-only access to the scripts from there and your Discord role is assigned automatically. Usually within a few hours.